Lark Bot of ChatBI
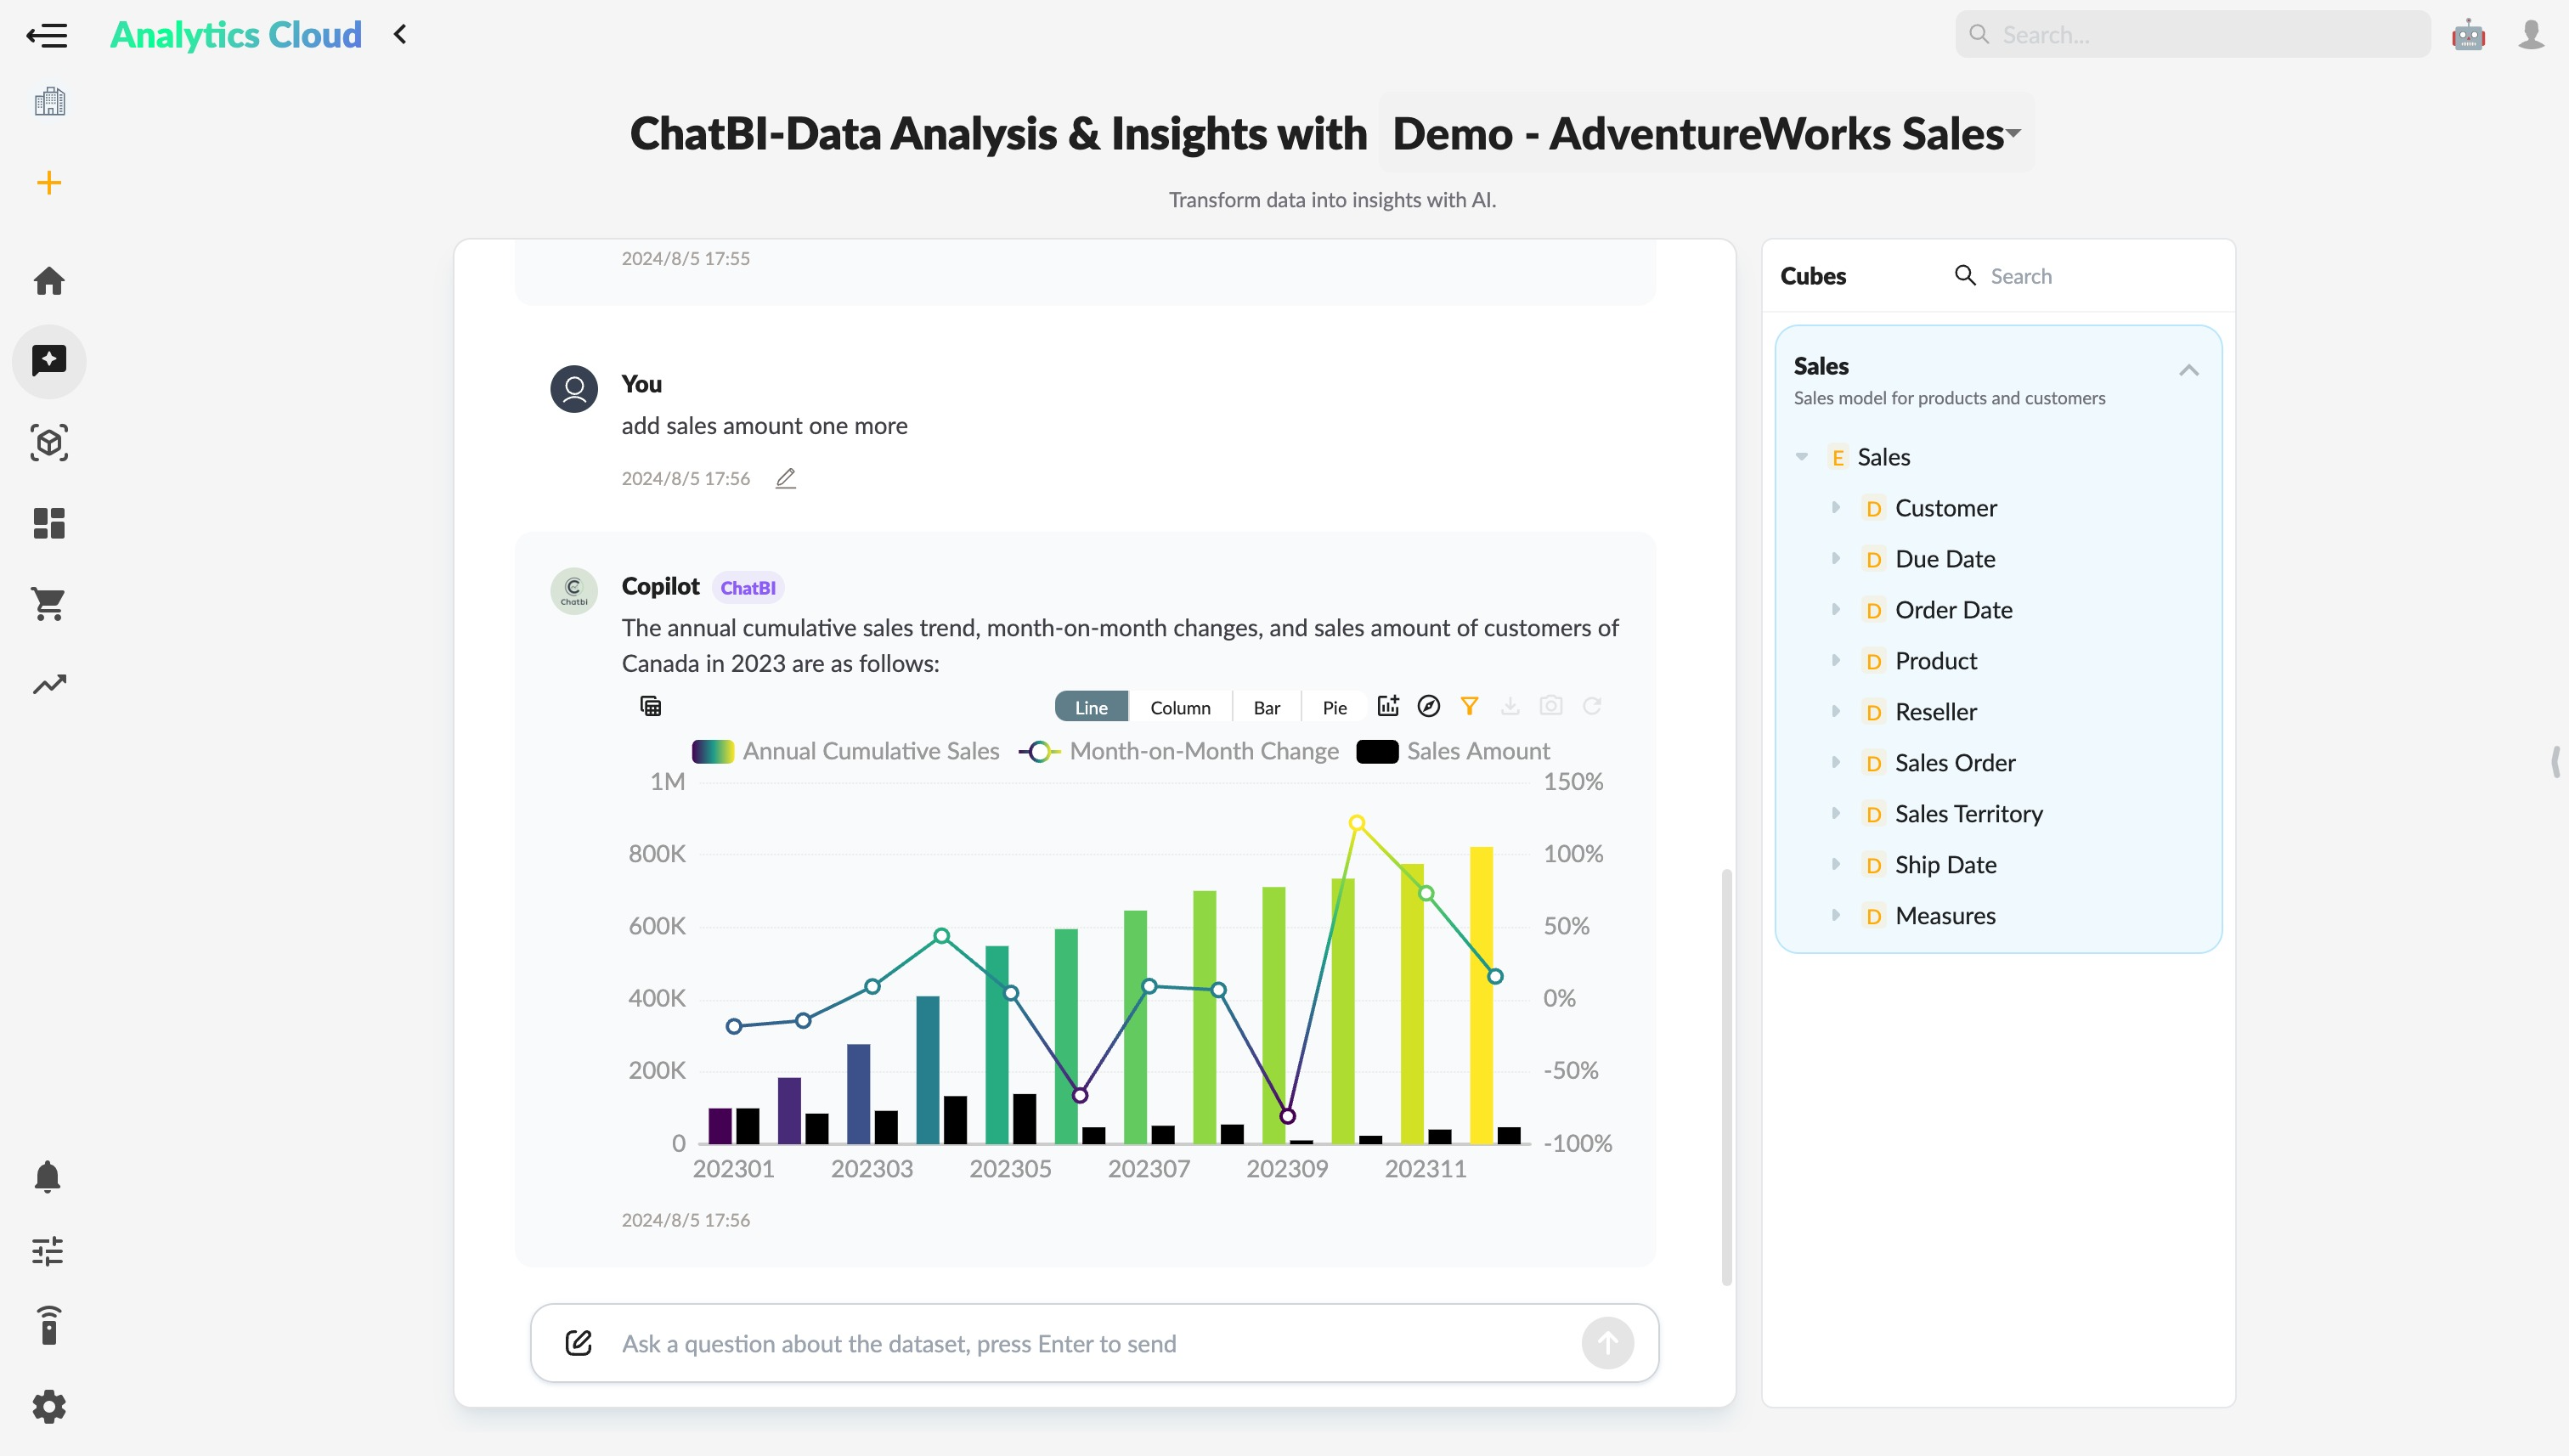
In a digital office environment, data-driven decision-making is becoming increasingly important. To help businesses utilize data more efficiently, the ChatBI bot provides an intelligent data querying and analysis solution on the Lark platform.
Through the ChatBI bot, Lark users can easily uncover the value of their data, enabling smarter decision-making and collaboration. Whether for personal use or team collaboration, ChatBI offers robust support for your data analysis needs.
For more details, see ChatBI Lark Bot.
ChatBI Updates
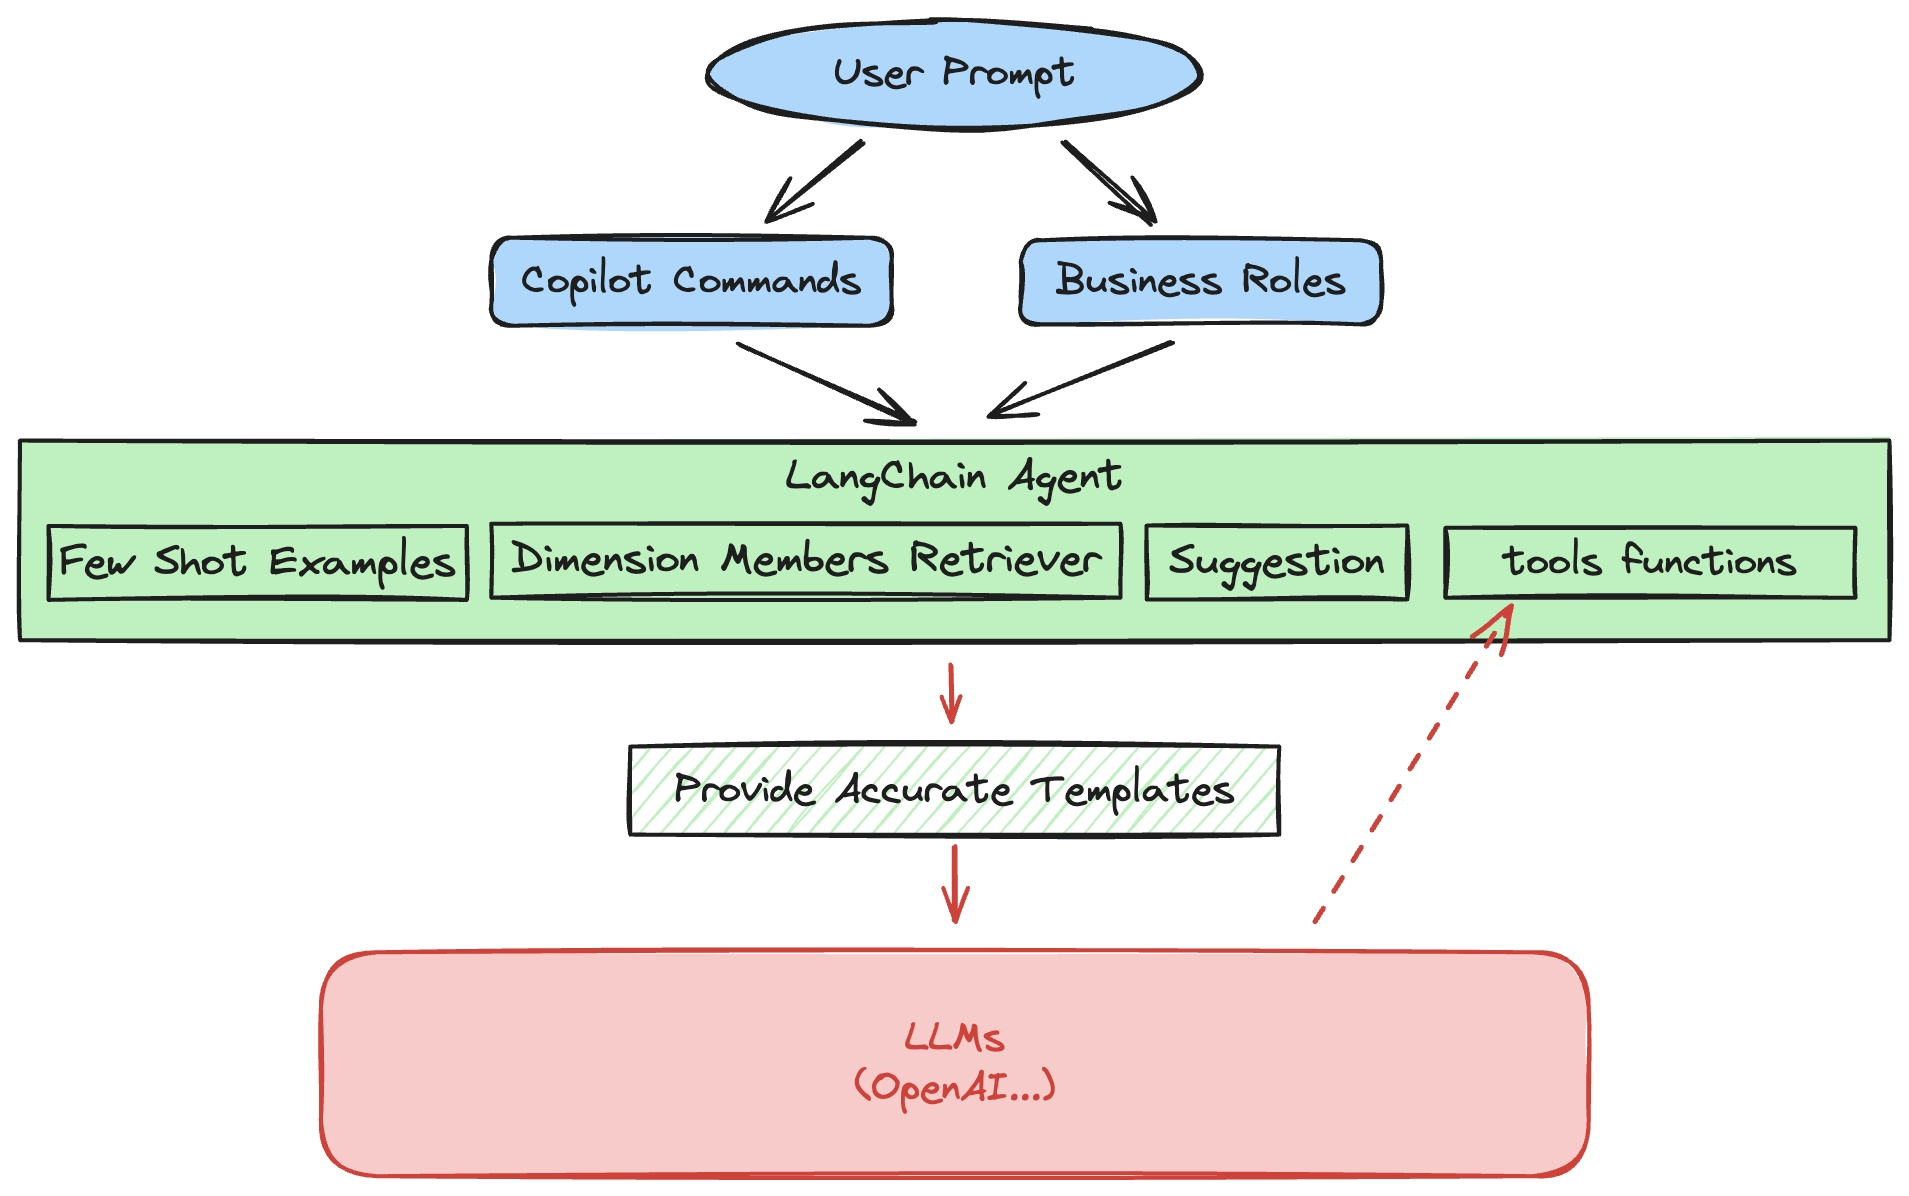
- Improved the agent logic for creating calculation indicators, enhancing its intelligence level.
- Added a question recommendation feature to help users quickly start conversations.
Lark Single Sign-On
- Supports identity authentication using Single Sign-On (SSO) on the Lark platform.
- Optimized the security and privacy protection mechanisms for SSO.